
Dashboard for Basic- and Expert-users
Display based on status
When displaying content, the dashboard distinguishes between:
- new customers
- existing customers
New customers see a compact overview with the most important entry points for getting started.
Existing customers receive a detailed view with key figures on marketing and acquisition activities.
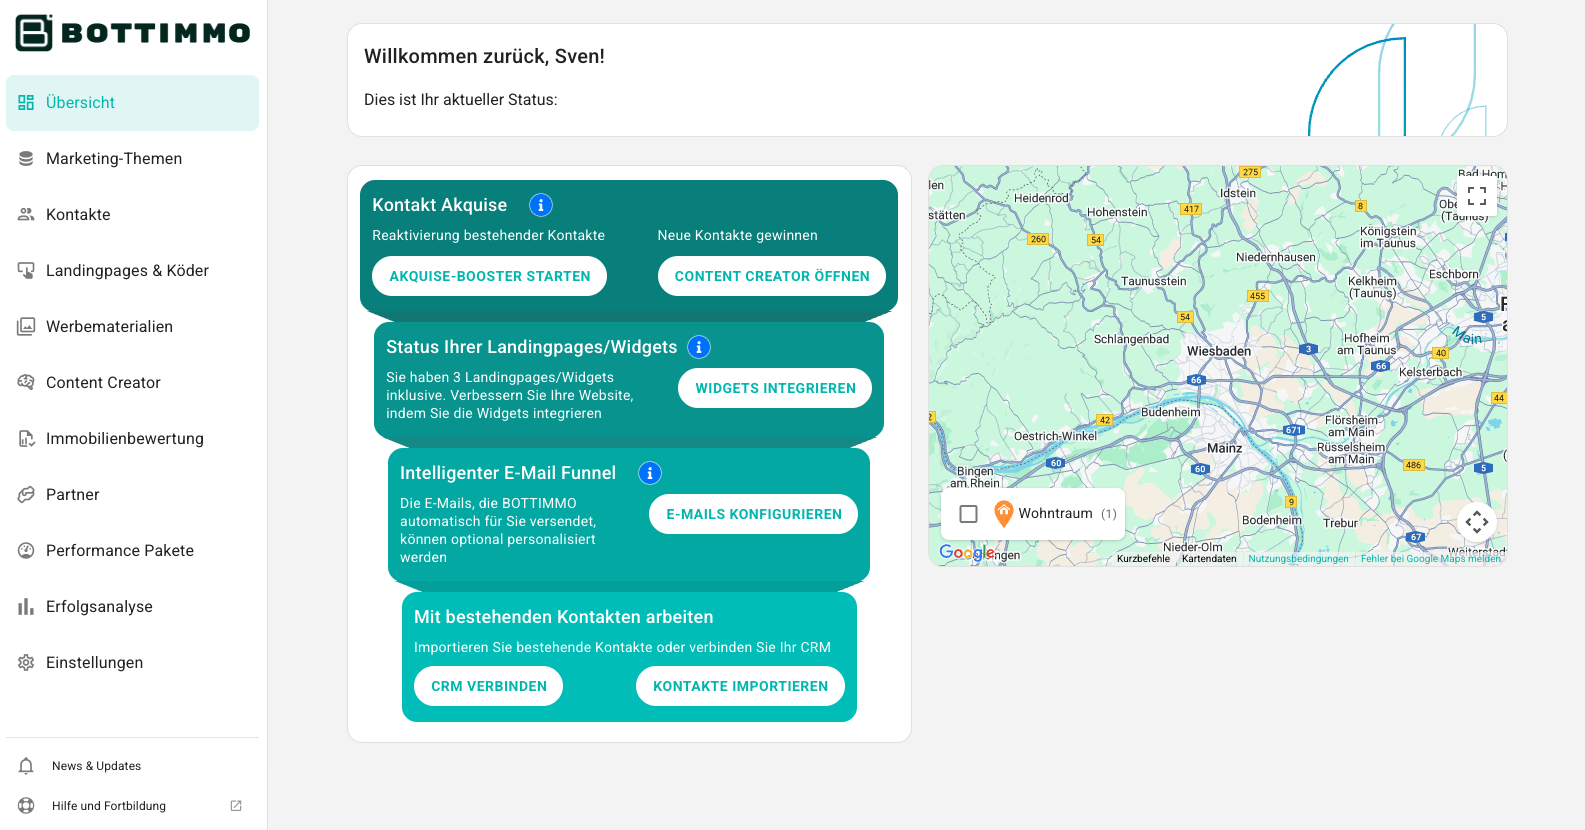
Display for new customers
The view for new customers contains core functions that are particularly helpful when getting started.
💡 Tips for getting started:
- Import your contact data into BOTTIMMO — either via a CRM integration or manually.
- Start your Acquisition Booster and send your emails to all imported contacts.
- Integrate your widgets into your website to increase their impact.
➡️ Using the white buttons (see screenshot), you can go directly to the corresponding functions:
Display for customers who have been using BOTTIMMO for a while
If you are already actively working with BOTTIMMO or have implemented the tips for new customers, you will see an expanded view with several boxes. Each box contains information on a specific area:
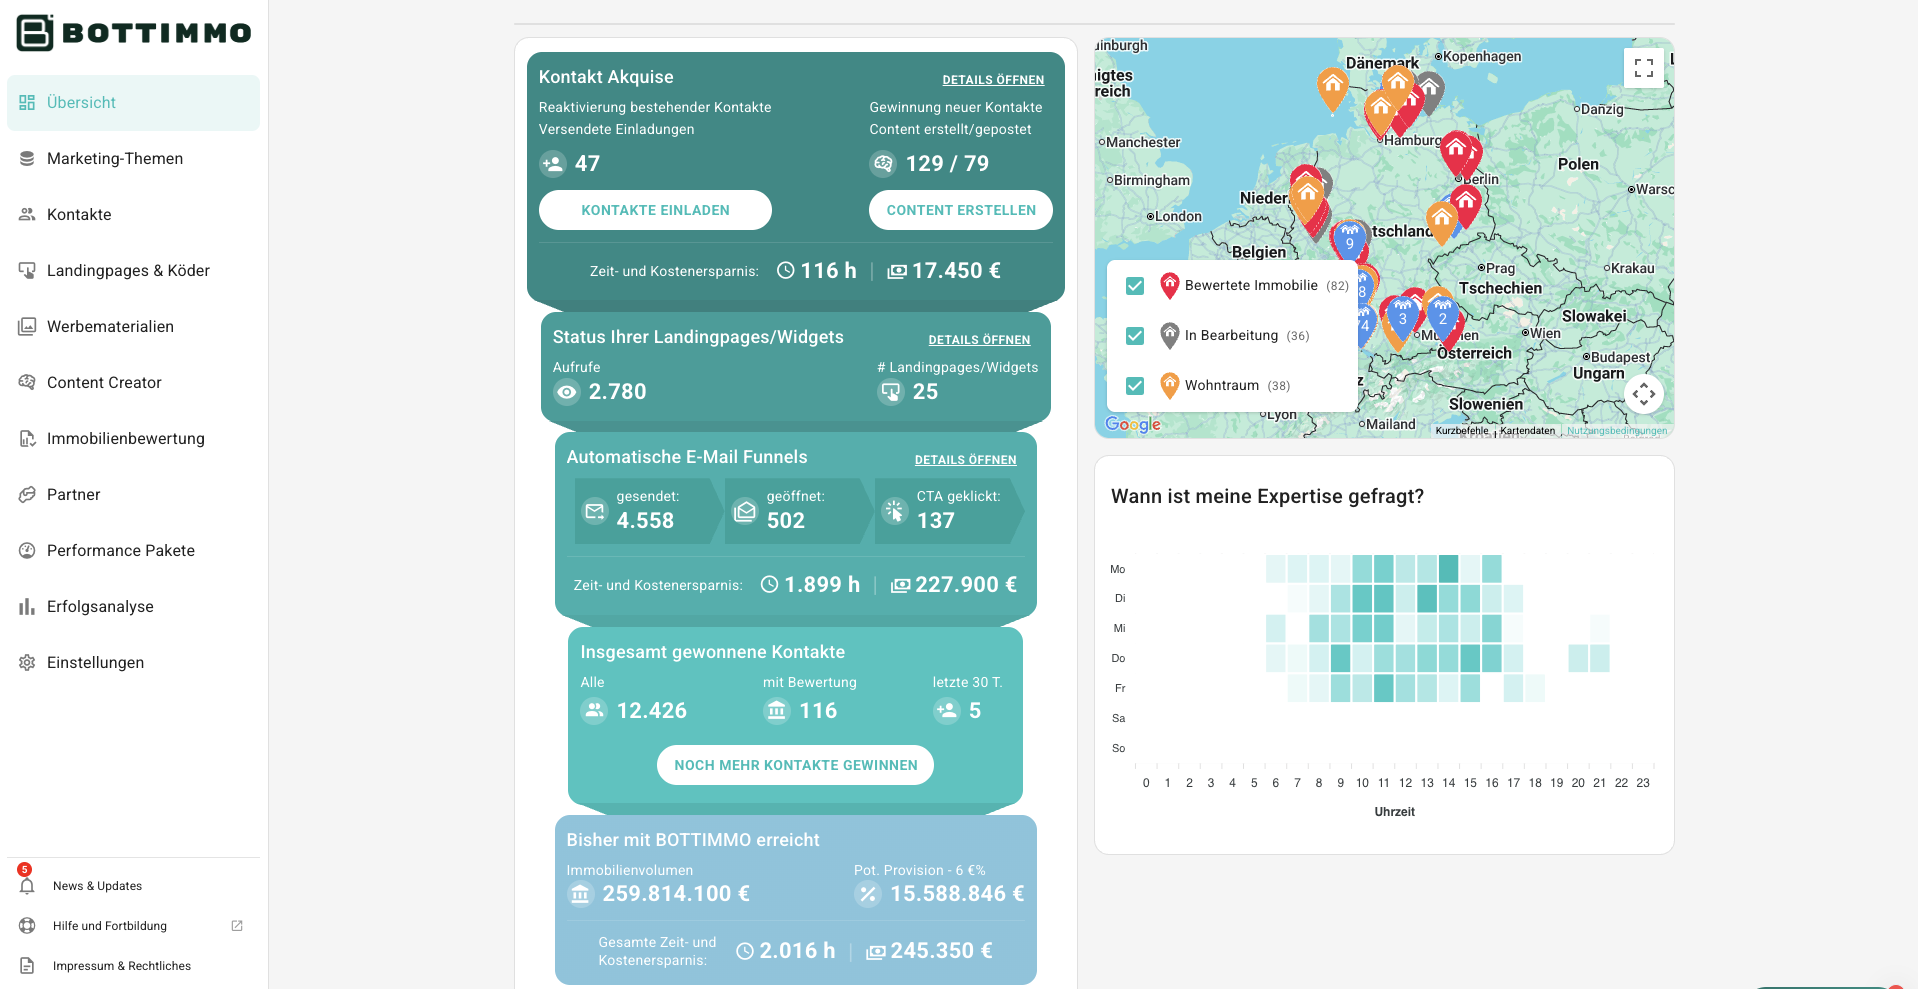
What exactly is shown here?
The view is divided into several boxes. Each box is dedicated to a specific area:
Contact acquisition
The top box is about acquiring new contacts. Here you can see how many invitations you have already sent via the Acquisition Booster and how many pieces of content have been created and published with the Content Creator.
The entry points for the Acquisition Booster and Content Creator remain visible because they should be used by you regularly.
Status of your landing pages and widgets
This box shows how often your landing pages and widgets have been accessed and how many of them are included in your package.
By clicking “Open details” (top right in the box) you get additional information – e.g. traffic by source and UTM parameters, provided these parameters were used, for example, in advertising campaigns.
Automatic email funnel
Here you can see:
- How many emails BOTTIMMO has automatically sent on your behalf
- How many of them were opened
- How often a button in the emails was clicked
It also shows how much time (and therefore cost) you have saved through automated sending – compared with writing and sending manually.
In the detailed view, you also receive information about sending over the last 30 days, including the reasons why certain recipients were not reached.
Total contacts acquired
This box shows how many contacts you have already acquired with BOTTIMMO.
Using the white button, you can reach the official BOTTIMMO partners who support you in acquiring further contacts. The services offered there are available on exclusive terms.
Achieved with BOTTIMMO so far
This box shows the total property volume that has been valued via the property valuation landing page or the property valuation widget, as well as the commission you could potentially have achieved as a result.
You also gain insight into the total time and cost savings achieved by using BOTTIMMO.
💡 Pro-tip: Always in Control – Even on the Go!
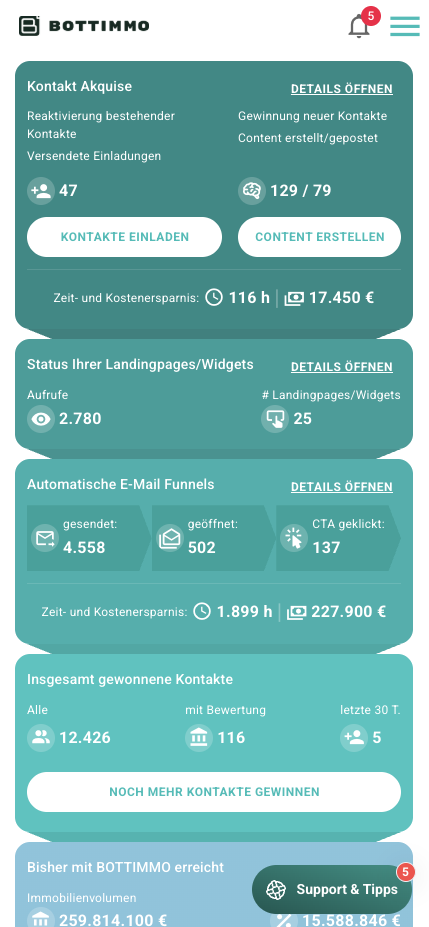
Access the BOTTIMMO dashboard directly from your smartphone and stay on top of your key metrics anytime, anywhere.
📱 Here’s how: Install the BOTTIMMO app on your mobile device.
Find the step-by-step instructions for your device here: